SA Power Networks' year to date operational performance

The Commission welcomes any comments and feedback on the contents of this webpage.
SA Power Networks operates the major South Australian electricity distribution network. This essential service is regulated by the Commission and the Australian Energy Regulator.
The Commission publishes quarterly statistics on SA Power Networks’ operational performance against the annual service standard targets and other indicators specified in the Electricity Distribution Code. This webpage only shows a subset of the data collected and monitored by the Commission on an ongoing basis.
How reliable were SA Power Networks' electricity distribution services?
(for the period 1 July 2018 - 31 March 2023)
SA Power Networks must use its best endeavours to comply with obligations relating to the quality, safety and reliability of electricity distribution services (including minimising supply interruptions and informing customers about planned interruptions).
For the three quarters to 31 March 2023, SA Power Networks reported the following:
- There were four major event day (MED) exclusions in October to November due to the impact of severe storms and flooding affecting a total of 171,747 customers in South Australia. There was an additional MED on 20 March due to severe wind storms which impacted 49,428 customers.
- The annual USAIFIn target for CBD feeders has been exceeded with a year-to-date performance of 0.18 against the target of 0.15.
See the monthly tracking of reliability of SA Power Networks’ electricity distribution services for monthly reliability performance by feeder type and region.
Monthly tracking of reliability of SA Power Networks’ electricity distribution services
How SA Power Networks responded to its customers
(for the period 1 July 2018 - 31 March 2023)
SA Power Networks must use its best endeavours to comply with obligations relating to customer responsiveness and enquiries (including requirements for time taken for to respond to customer enquiries from telephone calls and written enquiries).
For the three quarters to 31 March 2023, SA Power Networks reported the following:
- 252,796 telephone calls were received with 83 percent answered within 30 seconds.
- 10,744 written enquiries were received with 100 percent responded to within five business days.
How much did SA Power Networks pay under the GSL scheme?
(for the period 1 July 2018 - 31 March 2023)
SA Power Networks is required to make Guaranteed Service Level (GSL) payments to customers who have received service that is worse than the predetermined threshold.
For the three quarters to 31 March 2023, SA Power Networks reported the following:
- $239,975 was paid to customers who reported streetlight repairs where the streetlight was not repaired within the specified timeframe.
- $69,940 was paid to customers where their new connection took longer than six business days.
Year to date performance data is indicative of performance until finalised at the end of the regulatory year when achievement against service standards is determined.
Further information
The SA Power Networks’ regulatory framework (including the complete time series performance data for SA Power Networks).
The Distribution Code is the principal consumer protection document setting out the regulatory obligations (including service standards) to be complied with by SA Power Networks when dealing with its customers.
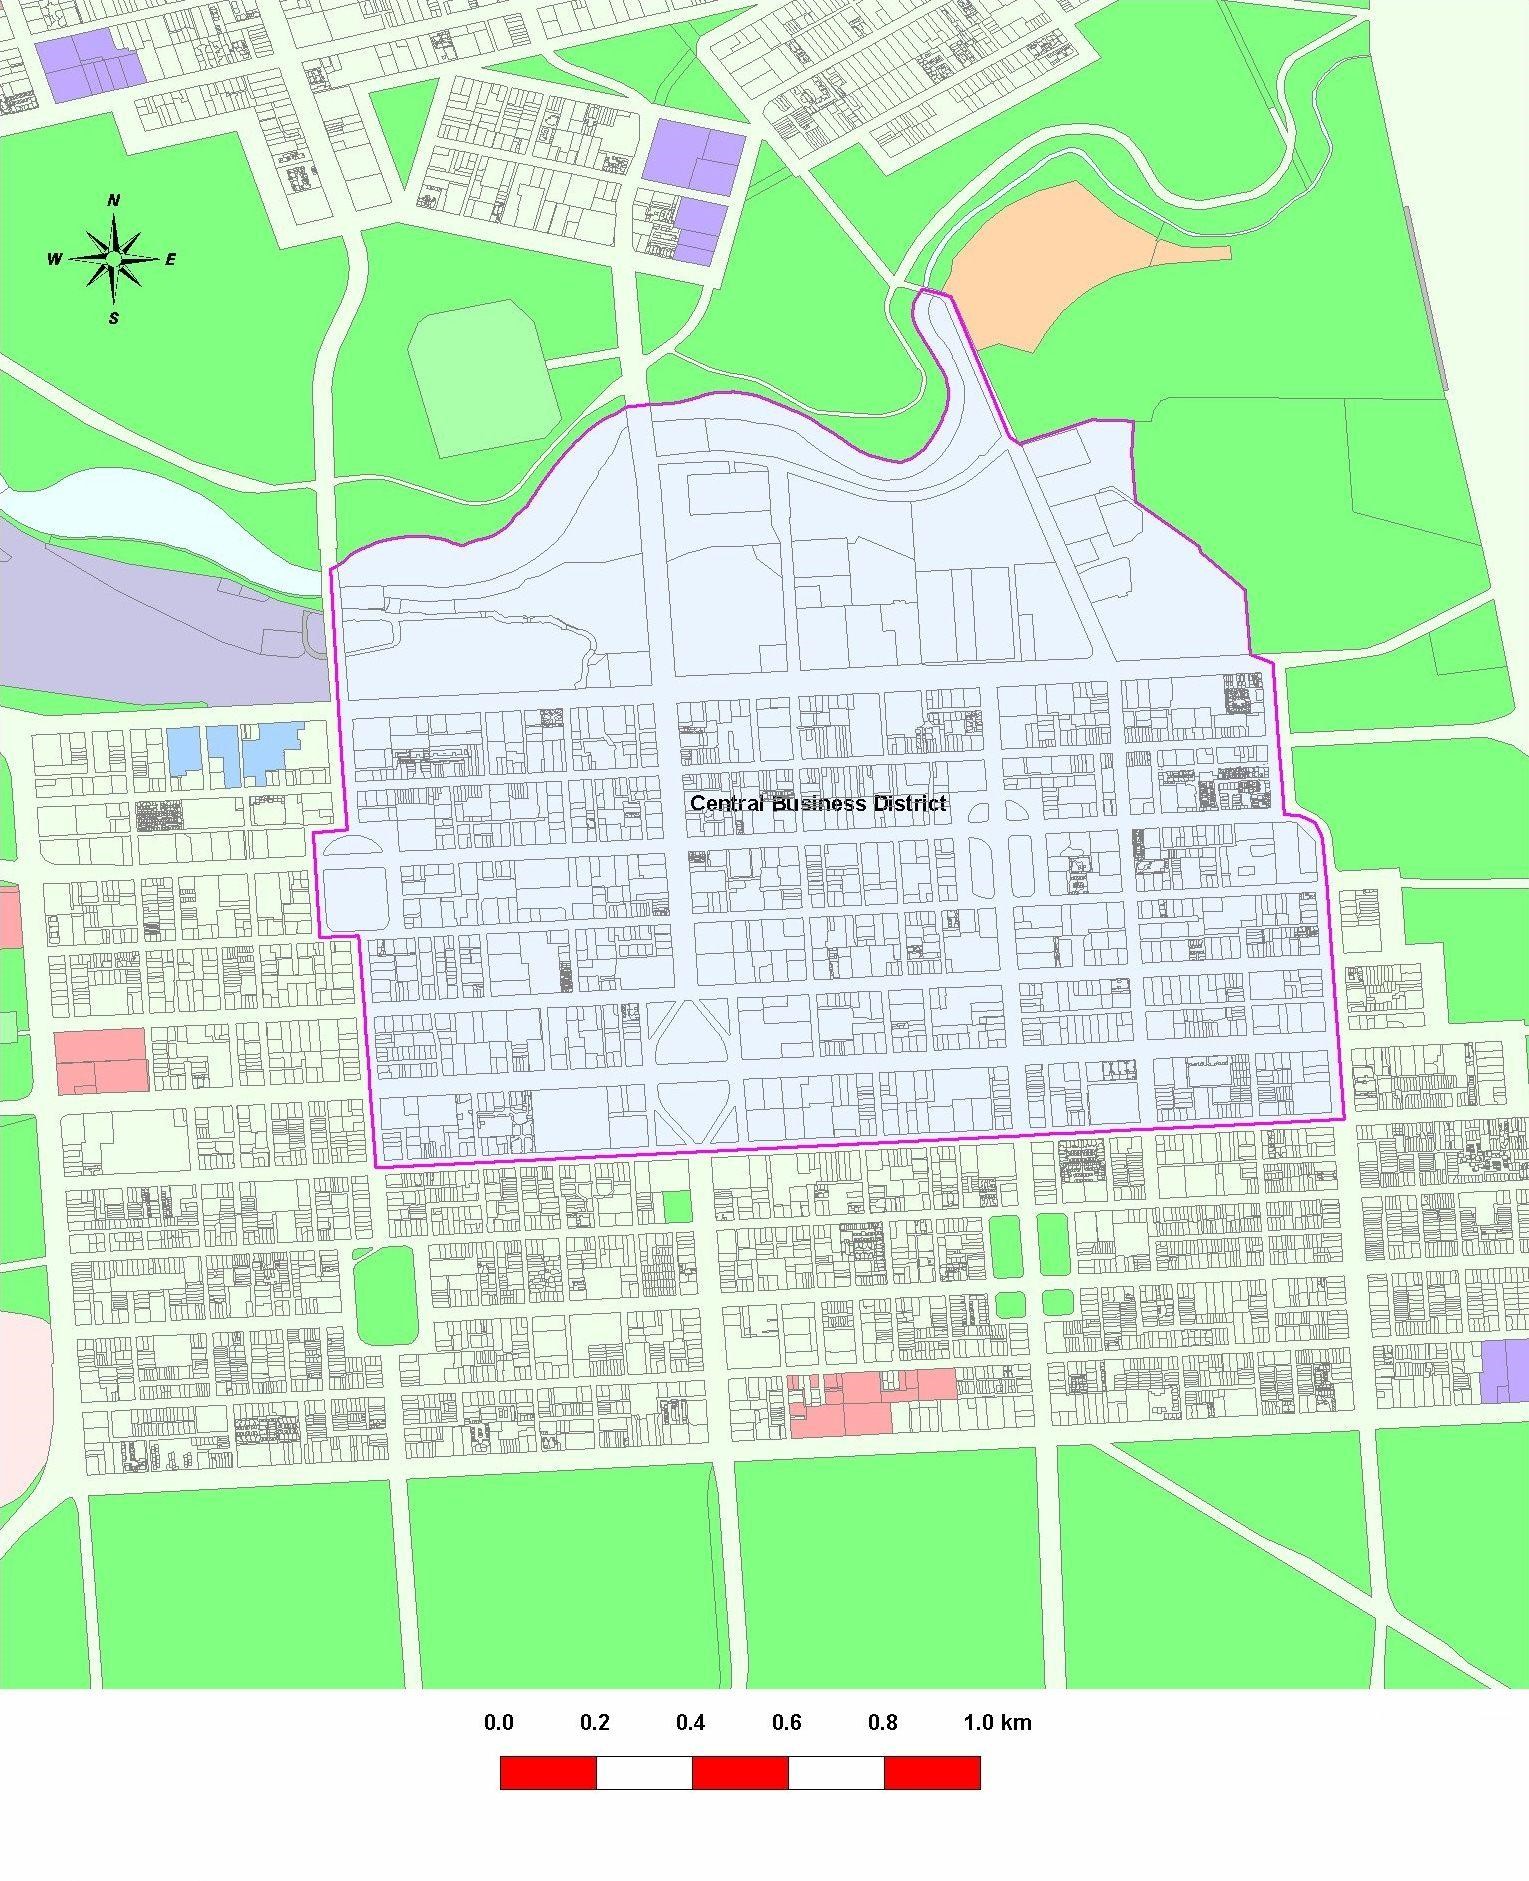
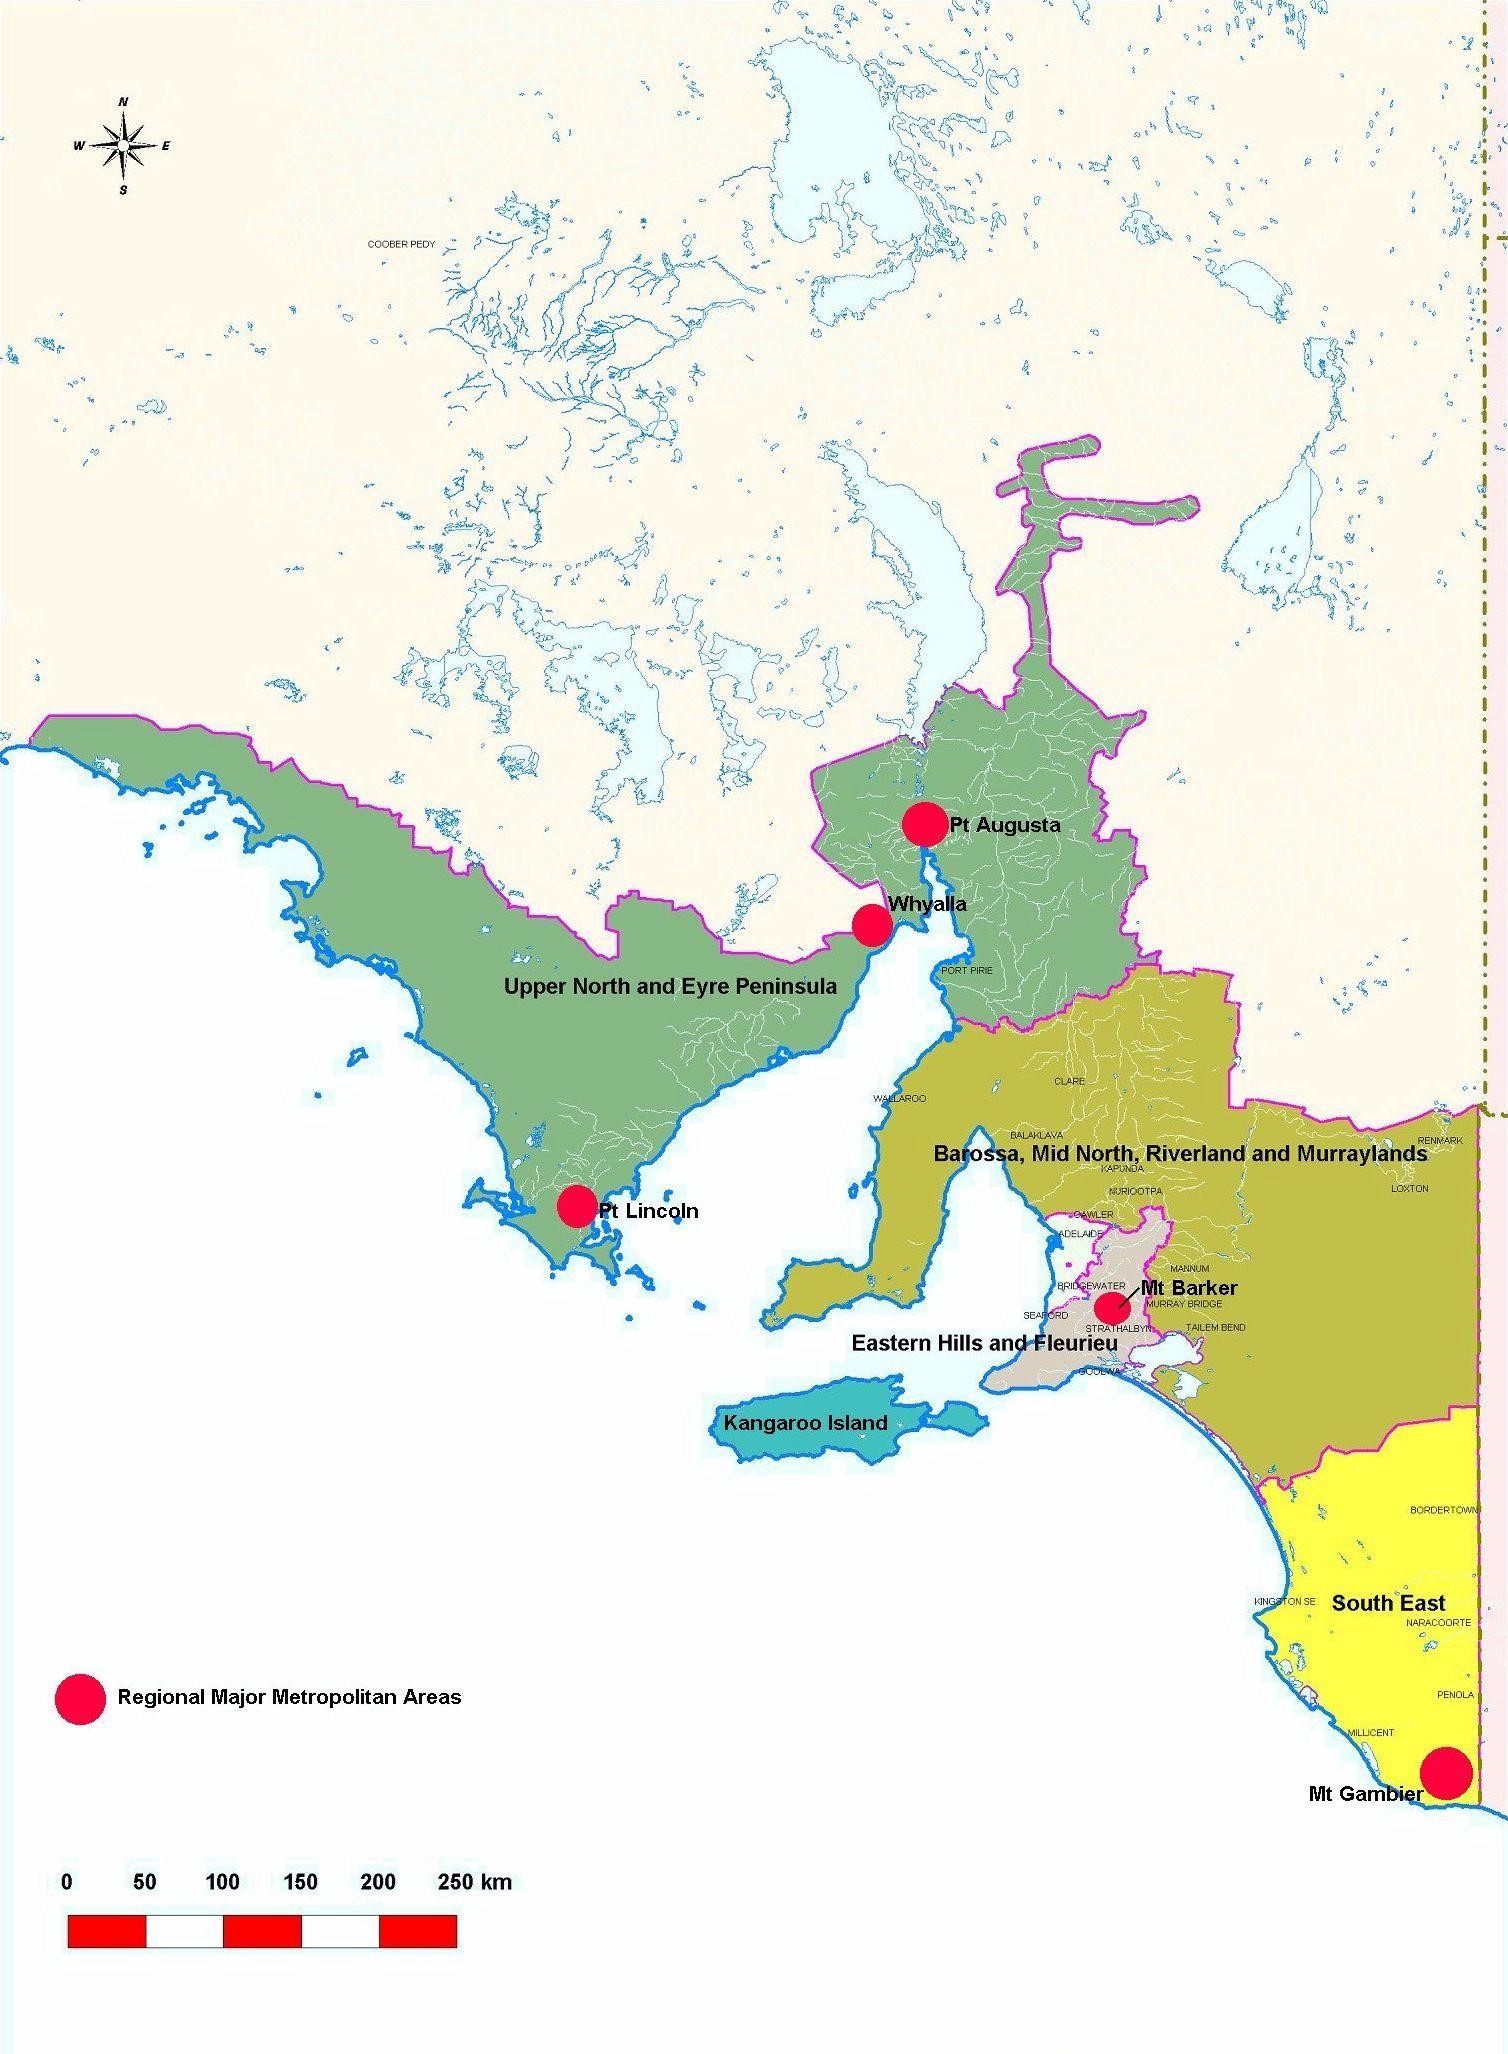
Maps of the geographical regions of SA Power Networks’ electricity distribution network (including the Greater Adelaide Metropolitan Area and Adelaide Business Area)
Map of regions
Map of greater Adelaide metropolitan area

Map of Adelaide business area
Maps prior to July 2020